
Beyond Pricing: Maximise Hotel Revenue with AI
Discover how AI transforms revenue management beyond pricing, segment analysis and channel mix. Boost profitability with BEONx. Read more here!


Revenue Management
How is RevPAR calculated for hotels? There are two ways to calculate RevPAR: Divide your total room revenue by the number of rooms: Total room revenue / Total rooms available For e

There are two ways to calculate RevPAR:
Total room revenue / Total rooms available
For example, if there are 90 sold rooms (90% of your availability) with an ADR of $100 gives you a total revenue of $9,000, divided by the 100 total available rooms, resulting in a RevPAR of $90.
$9,000 / 100 = RevPAR $90
Occupancy rate x ADR
For example, if there are 100 rooms available with an occupancy rate of 90% and an average daily rate of $100, the formula would be.
0.90 x $100 = RevPAR $90


RevPAR is a key metric for hotel revenue managers because it indicates the performance of a hotel’s pricing strategy as well as its distribution strategy. A low RevPAR would indicate that either room pricing is too low or the hotel has a low occupancy rate, which a hotel revenue manager can then investigate through looking at competitor rates, historical trends and seasonality. This information can then be used to adjust pricing and distribution strategies accordingly to boost revenues and profits.
Room pricing and occupancy rate are the two key areas that a hotel revenue manager can use to improve RevPAR performance.
In terms of room pricing, it’s vital for larger hotels to use a powerful RMS, like BEONx, to understand their positioning in the market versus competitors and to test how different pricing strategies impact sales. For example, BEONx uses machine learning and AI to provide hotels with data-driven pricing recommendations that take into account your competitors, seasonality, historical trends, price elasticity and more.
Equally, if a hotel’s occupancy rate is low, revenue managers could look at the information available on the performance of different booking platforms and OTAs, as well as looking at competitors, seasonality and historical trends, in order to identify what might be driving the low occupancy rate. With this information to hand, different strategies could be implemented to boost occupancy, such as offering special promotions, increasing penalties for cancellations and offering loyalty programs to encourage customers to return.
Consider RevPAR as a double tap where ADR and OCC must contribute in a balanced way to fill the profitability bucket. It is the job of the revenue management team to establish strategies that balance both variables to achieve optimal RevPAR.


ADR stands for Average Daily Rate and it is a simple metric that looks at the number of rooms sold over a given period and their average price. Unlike RevPAR, ADR doesn’t account for the total number of rooms available through looking at your hotel’s occupancy rate.
As it takes into account the total number of rooms, RevPAR will always be a lower figure than ADR, except when the OCC is 100%, at which point both KPIs will be equal.
RevPAR is often considered a more robust metric than ADR because it takes into account the hotel’s occupancy rate, which gives a more holistic view of performance across your entire operation. A hotel might have a strong ADR but a low occupancy rate and consequently a low RevPAR, which could be a cause for concern if this trend persists because unoccupied rooms generate no revenue to cover the overheads of running a successful hotel business.
The RevPAR also allows to compare the performance of different competitors in a fairer way, as it takes into account the size of the property. For example, given a 100-room hotel A, and a 200-room hotel B, let’s imagine that both sell 50 rooms, earning €5,000 in revenue. In both cases, the ADR is €100. But Hotel A gets a RevPAR of €50, while Hotel B gets a RevPAR of €25. The occupancy rate, and therefore the RevPAR, of Hotel B has been much lower, as it is a larger hotel and needs higher figures to be profitable.


As we’ve seen above, RevPAR calculates the average price of an available room by looking at the average room price and the occupancy rate. RevPAG (Revenue per Available Guest) is the result of dividing the Rooms Revenue per total number of of Guests in-house for a specific period of time. RevPAG will usually be lower than RevPAR, depending on the average number of guests per room. While RevPAR refers to the total amount of available rooms, RevPAG considers the number of guests, which is very useful in terms of calculating resource requirements such as cleaning, bedding, breakfast, etc.
Both RevPAG and RevPAR are important metrics to understand the customer behaviour. While RevPAR can give you information about the performance and profitability of your room sales, RevPAG (being a “per person” KPI) is bringing knowledge as to which segments are the most profitable for your business.
Sustainable profitability is an approach that transforms sustainability from an operating cost into a profit centre for your hotel. Moving from a hotel revenue management approach to a sustainable profitability strategy will allow you to optimise the use of resources and maximise resource efficiency in order to intelligently retain revenue and unlock maximum value for your customers.
With BEONx, you can leverage sustainability as a profit driver within a holistic, guest-centric approach to profitability. From seamless guest messaging and time-saving automations, to intelligent upselling and revenue auditing, our platform helps hotels align sustainability and profitability for a lasting impact on guest experience and the bottom line.


Discover how AI transforms revenue management beyond pricing, segment analysis and channel mix. Boost profitability with BEONx. Read more here!

Maximize hotel revenue and balance occupancy by integrating a tour operator module into your RMS, optimizing pricing and strategic decisions.

Discover four key trends and expert tips to optimize hotel revenue strategies in 2024, leveraging AI, sustainability, personalization, and market data integration.
Speak with one of our dedicated hotel experts and get started on your journey to sustainable profitability.
Other Articles

Learn how Lungarno Collection increased ADR by 5-10% and automated pricing strategies using BEONx AI-driven Revenue Management System.

How Omena Hotels strengthened profitability and improved RevPAR through automation, forecasting and real-time pricing intelligence with BEONx.

Deloitte has announced the results of the latest edition of the “Deloitte Technology Fast 50 Programme,” the prestigious ranking that identifies the 50 most scalable technology com
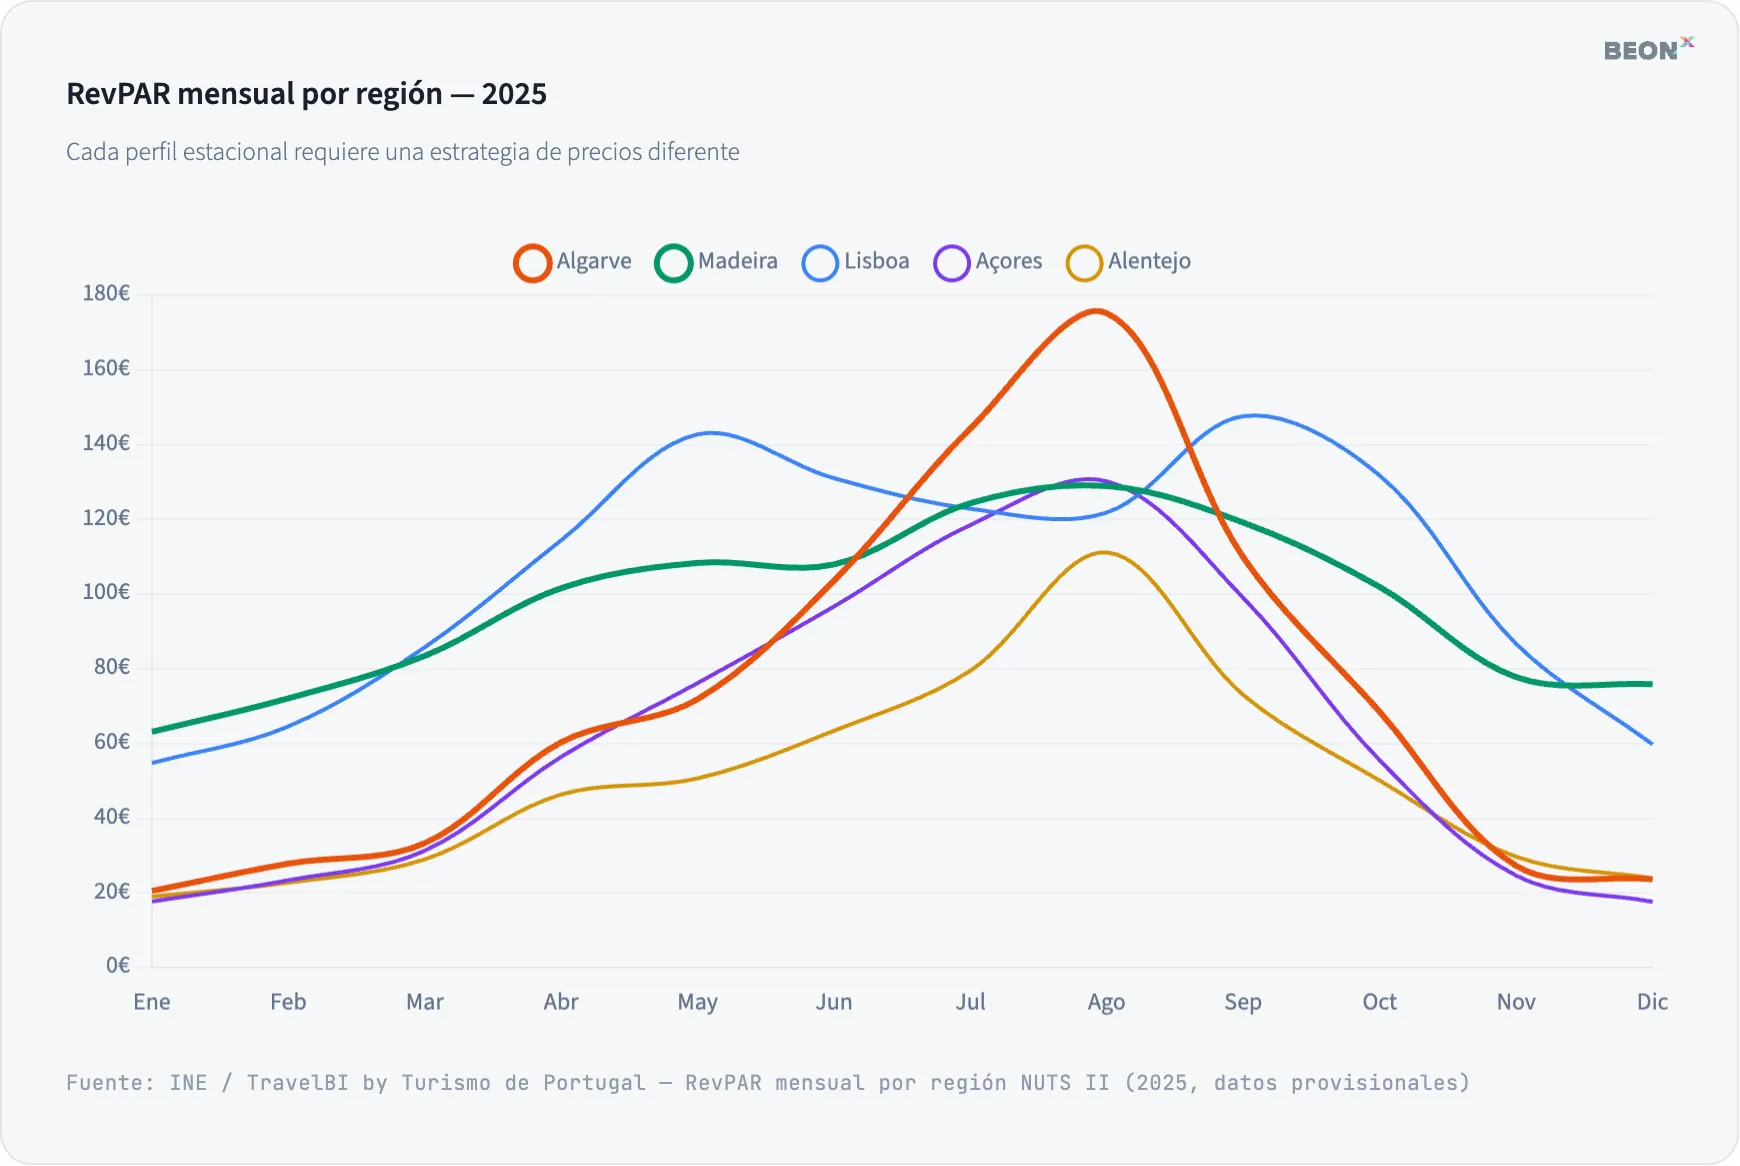
Growth that is losing momentum The hotel market in Portugal continues to break records year after year, but the data reveals a more nuanced reality, a RevPAR of €72.38, growth of +

Concept Hotel Group boosts revenue performance with BEONx through automation, Smart Range, and data-driven decision-making.

From intuition to intelligence: how Kora Living achieved 20% RevPAR growth and built a smarter, data-driven revenue strategy with BEONx.

Colombia’s hotel industry is evolving fast. Learn how to anticipate demand, use AI to optimize pricing, and compete on value rather than price. A vision of the future of revenue management from BEONx, Lighthouse, and CloudBeds.

On September 15–16, 2025, BEONx participated in HSMAday 2025, held at the Maritim Hotel in Cologne. The event brought together over 500 professionals from the hospitality sector to

BEONx empowered Kali Hoteles team to move from reactive to proactive pricing strategies, detect market shifts early, and implement optimal pricing by room type—improving not just profitability but also internal collaboration and confidence. %

Redefine your pricing strategy with SmartRange by BEONx – the AI-powered model that stabilises rates, minimises volatility and boosts profitability beyond the compset.